At Purdue Space Program, we're developing a liquid bipropellant rocket, and I'm one of the Avionics leads. The avionics system's job includes actuating solenoid valves to pressurize the propellant tanks, read sensor data, fire pyros for valves and engine ignition, etc.
In order to orchestrate all this, and to view sensor data while on the ground, we needed a dashboard software. The first place we looked was Grafana. Almost everything about Grafana was perfect, except its plotting performance. We had multiple sensors logging at thosuands of samples a second, all of which needed to be visualized. We also tried OpenMCT, which turned out to be less than satisfactory with an undocumented interface.
The conclusion I reached was that we needed a custom dashboard, so lo and behold, PSPieChart was born. The first iteration of this software turned into a proof-of-concept of a better plotter, and that turned out to be the only thing it was successful at. Everything other than that was a mess. Learning my lesson, I rewrote the whole thing. The screenshot above is the current state of PSPieChart.
It features high-data rate plotting with real-time downsampling (nothing too fancy, just average every n samples, where n is the right amount to occupy a horizontal pixel). The system to manage all your sources and charts and stuff is also super neat. It's similar to inodes, where each source is like a file. Things like charts and dashboards are treated as directories. And to wrap it all up, there's a very readable factory pattern to decide how to render the currently selected item, both in the tree and the main view. If you want a data source to, say, be in a chart, you'd just create a "hard link" by dragging the source into the chart. Very intuitive!
It's written in React, and packaged with Vite. The line count comes in under 2000 SLOC, and the final bundle clocks in just under 250 kB, gzipped. PSPieChart is a lean, mean, charting machine. Responsiveness and precision are prioritized over everything else.
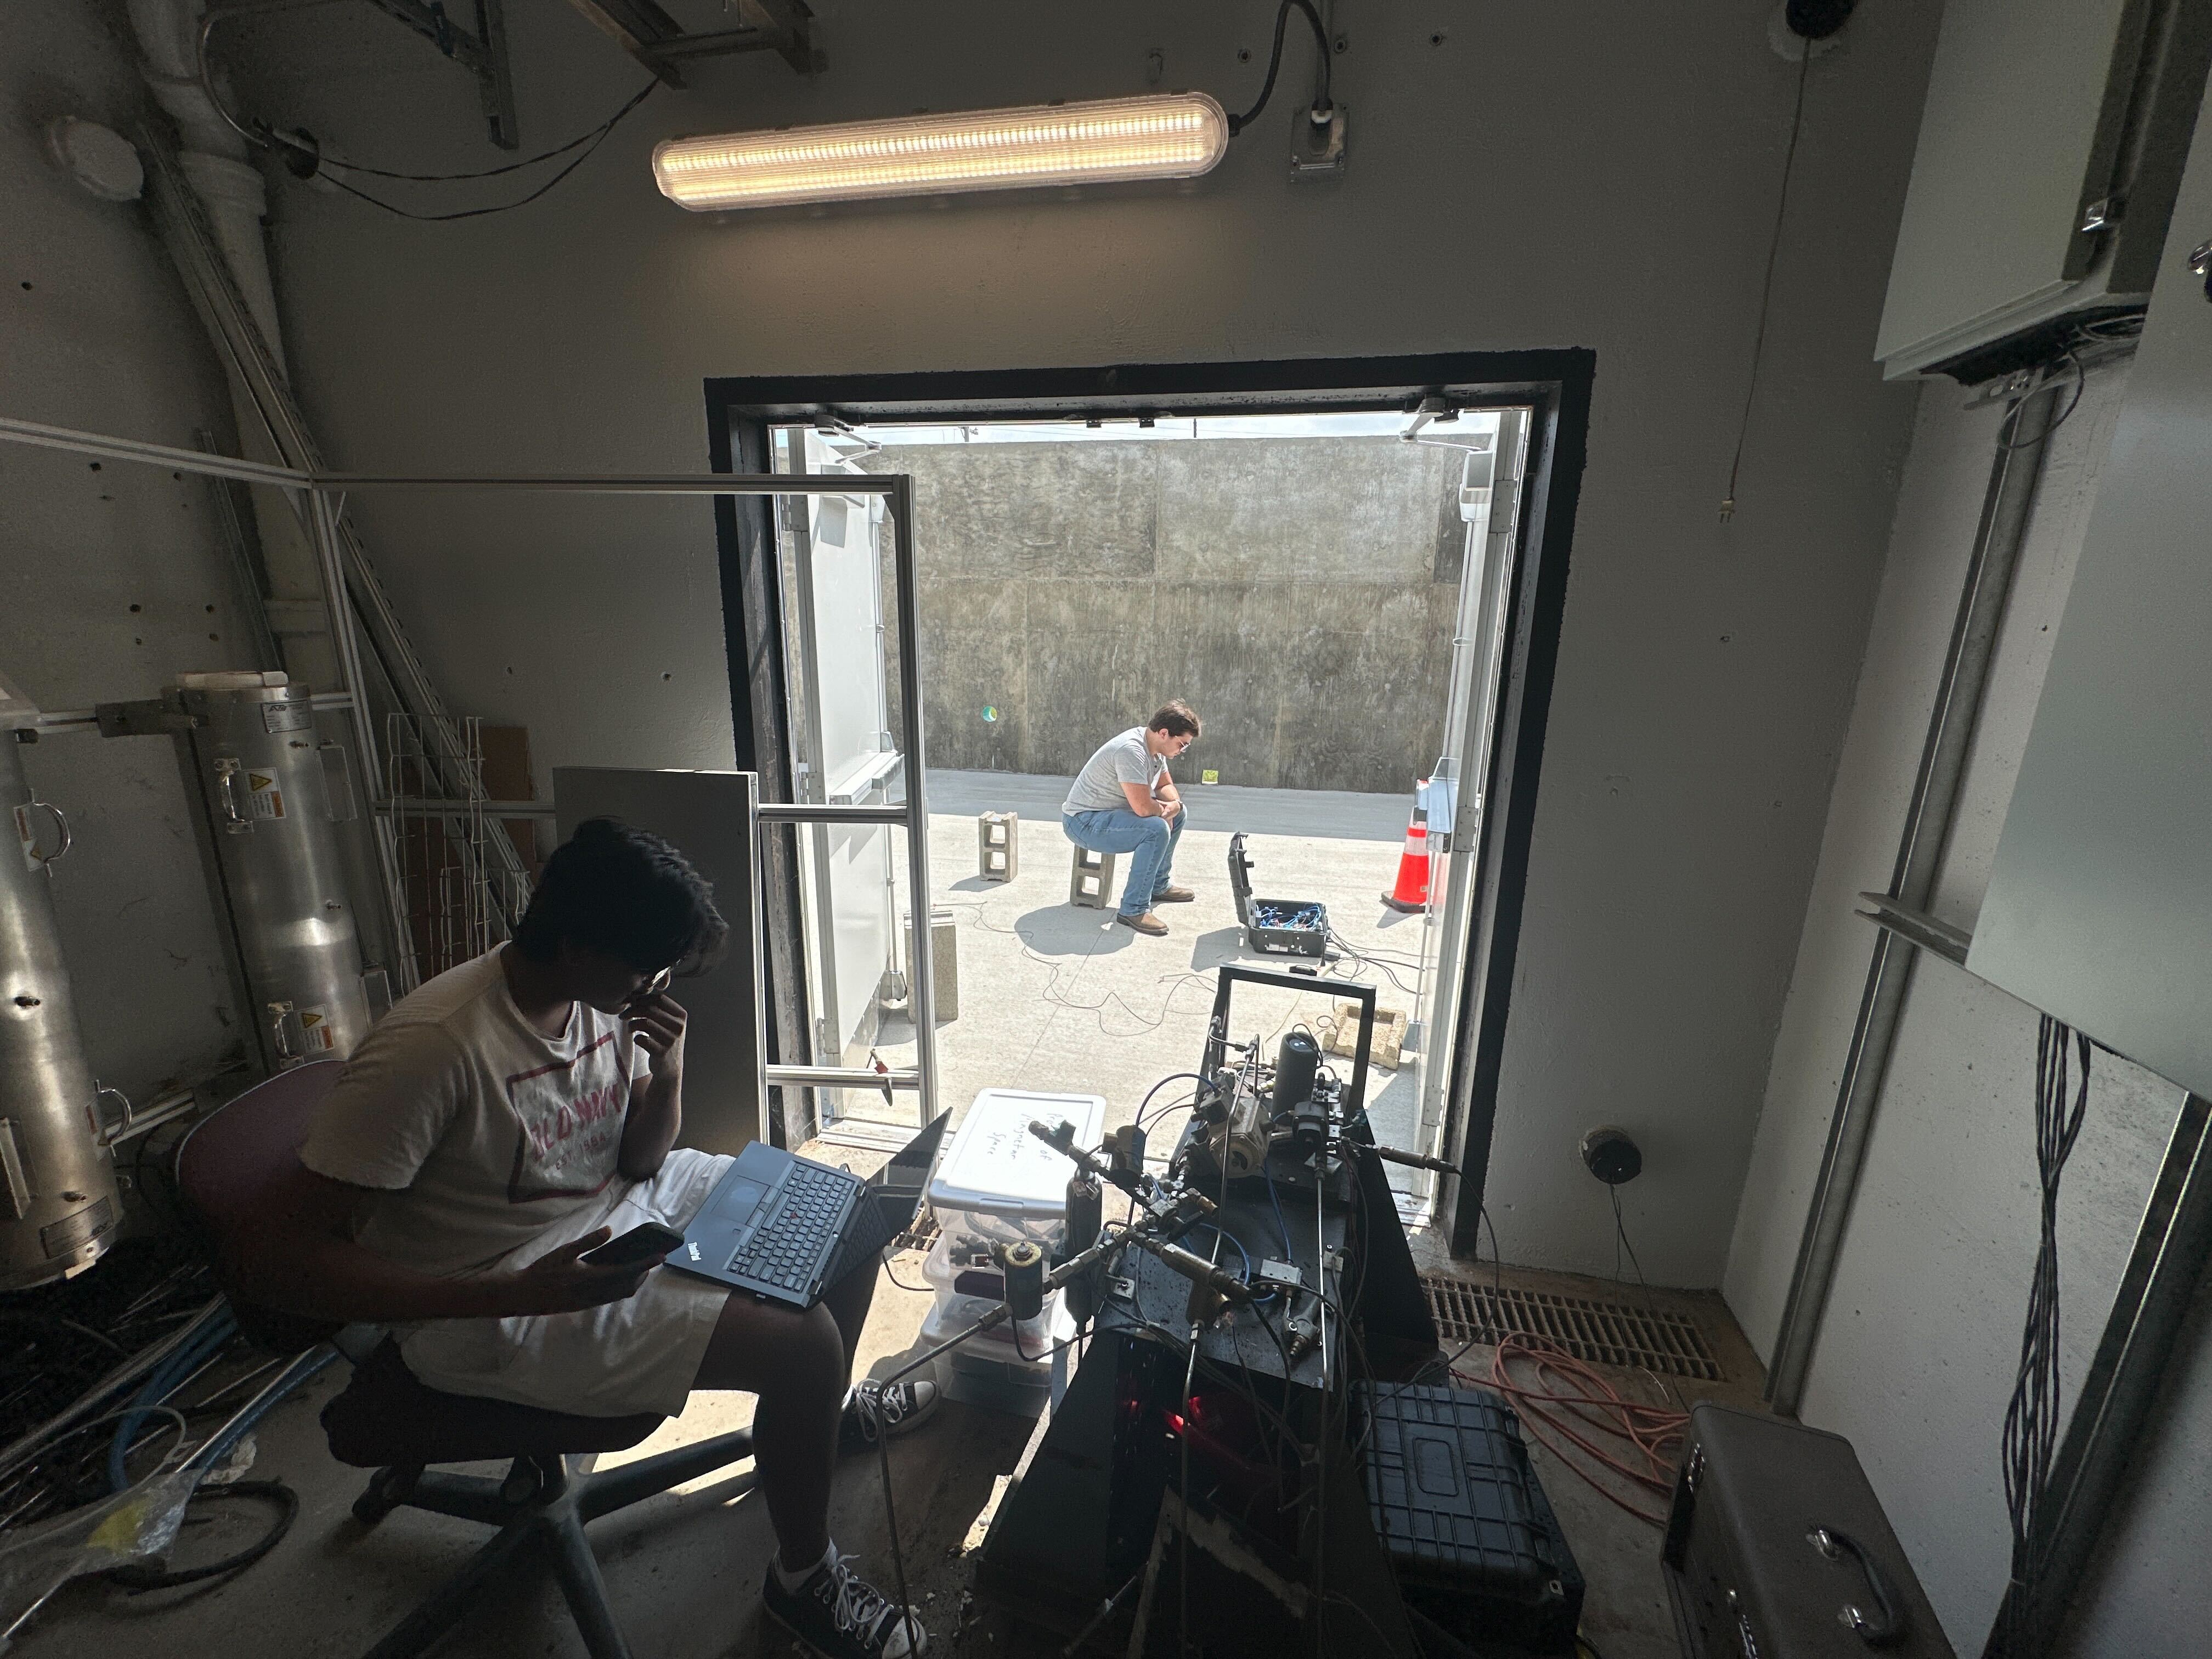
Here's PSPieChart in action! We conducted a successful test of the pyrotechnic channels, using PSPC as our dashboard.